Resources
On this page you will find resources and tutorials to help DataJam teams plan their DataJam project, find datasets to use for their project, learn to use a number of analytical programs including Google Sheets, Excel, Tableau Public, R Studio, GGPlot, and Python as well as guidelines for making a DataJam poster and putting together a DataJam Presentation.

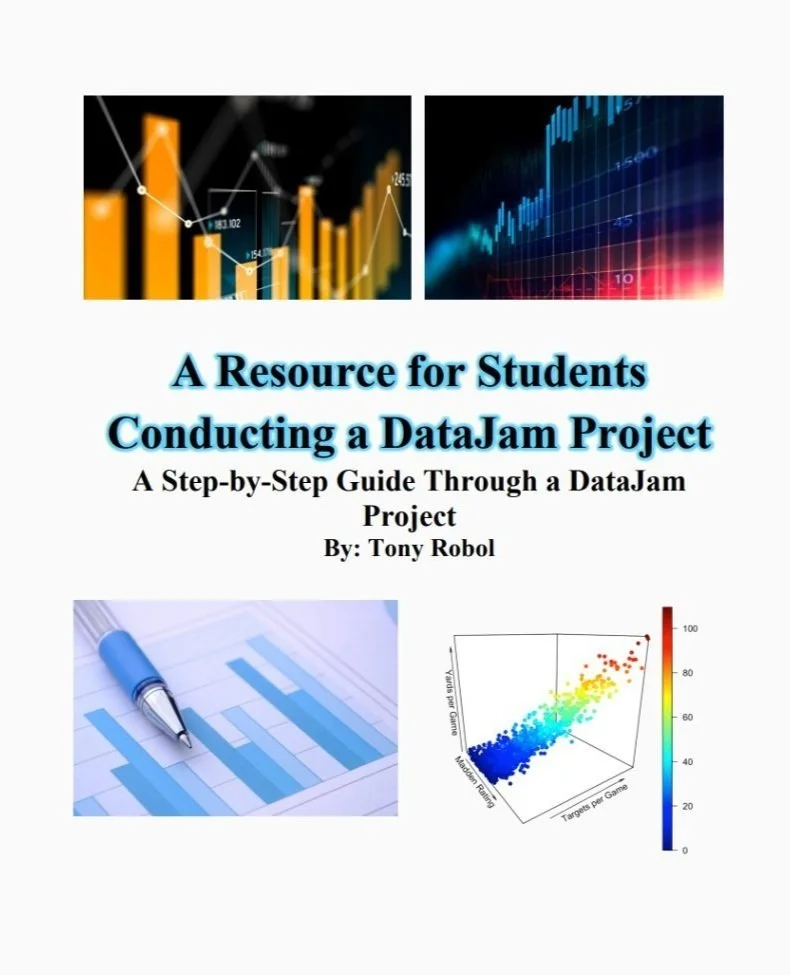
How to Conduct a DataJam Project Guide
This is “A Step-by-Step Guide Through a DataJam Project”, produced by DataJam mentor: Tony Robol. Part 1 of the guide provides ten 1-2 page sections on various statistical procedures a team will want to think about when analyzing data for a DataJam project. Part 2 provides a detailed overview of how to conduct a DataJam Project.
Game-Changing DataJam Guides
We have made a variety of guides to help DataJam teams develop proposals, provide step-by-step guidance through a DataJam project, De-Stress the DataJam experience, make sure your DataJam project includes data from diverse populations, ensure research data quality, and bring a public health perspective to your DataJam project.

Setting up to Strive with Google Sheets
Google Sheets, Excel’s younger brother, is great for Data Analysis! Find out how to do various analytical procedures in the links below.

Excited to Excel with Excel?
Whether you are an Excel newbie or a seasoned veteran, these links provide a jump start to your project!

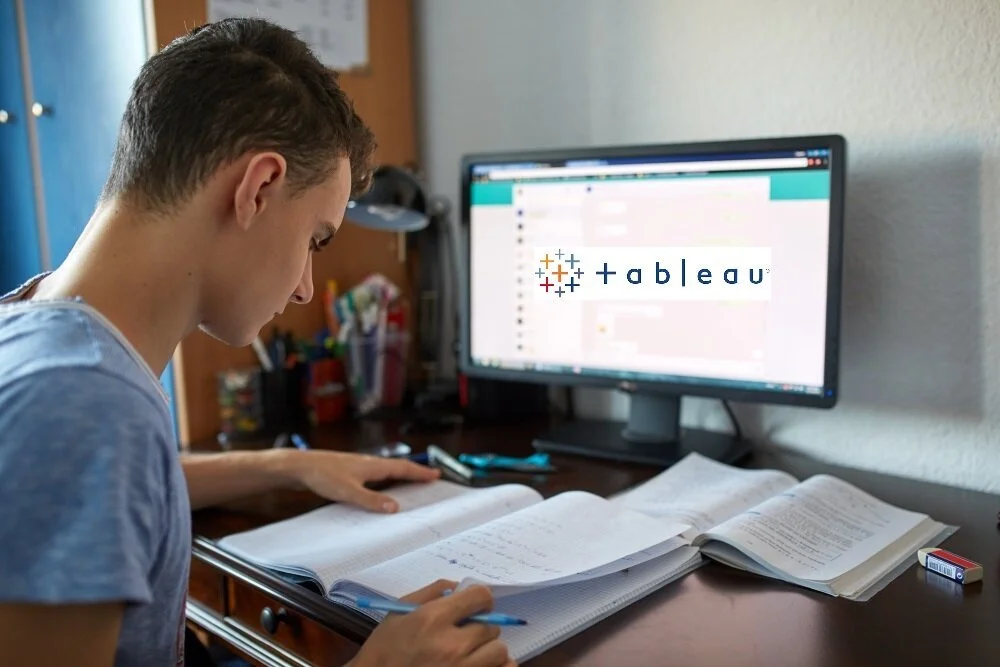
Long to Grow with Tableau?
Tableau is a useful data visualization software to help put your project on display!
Ready to Reason with R-Studio?
Tired of using the same, old data analytics tools? Try your hand at R-Studio using these resources to guide you!

Push Forward with Python
These guides provide additional instructional tips on various data analytics and visualization tools used in Python. Google Colab is a program that allows you to write and execute Python code to customize how you work with data. We will also show you how to save your Python code to GitHub to keep your DataJam Project analyses organized!
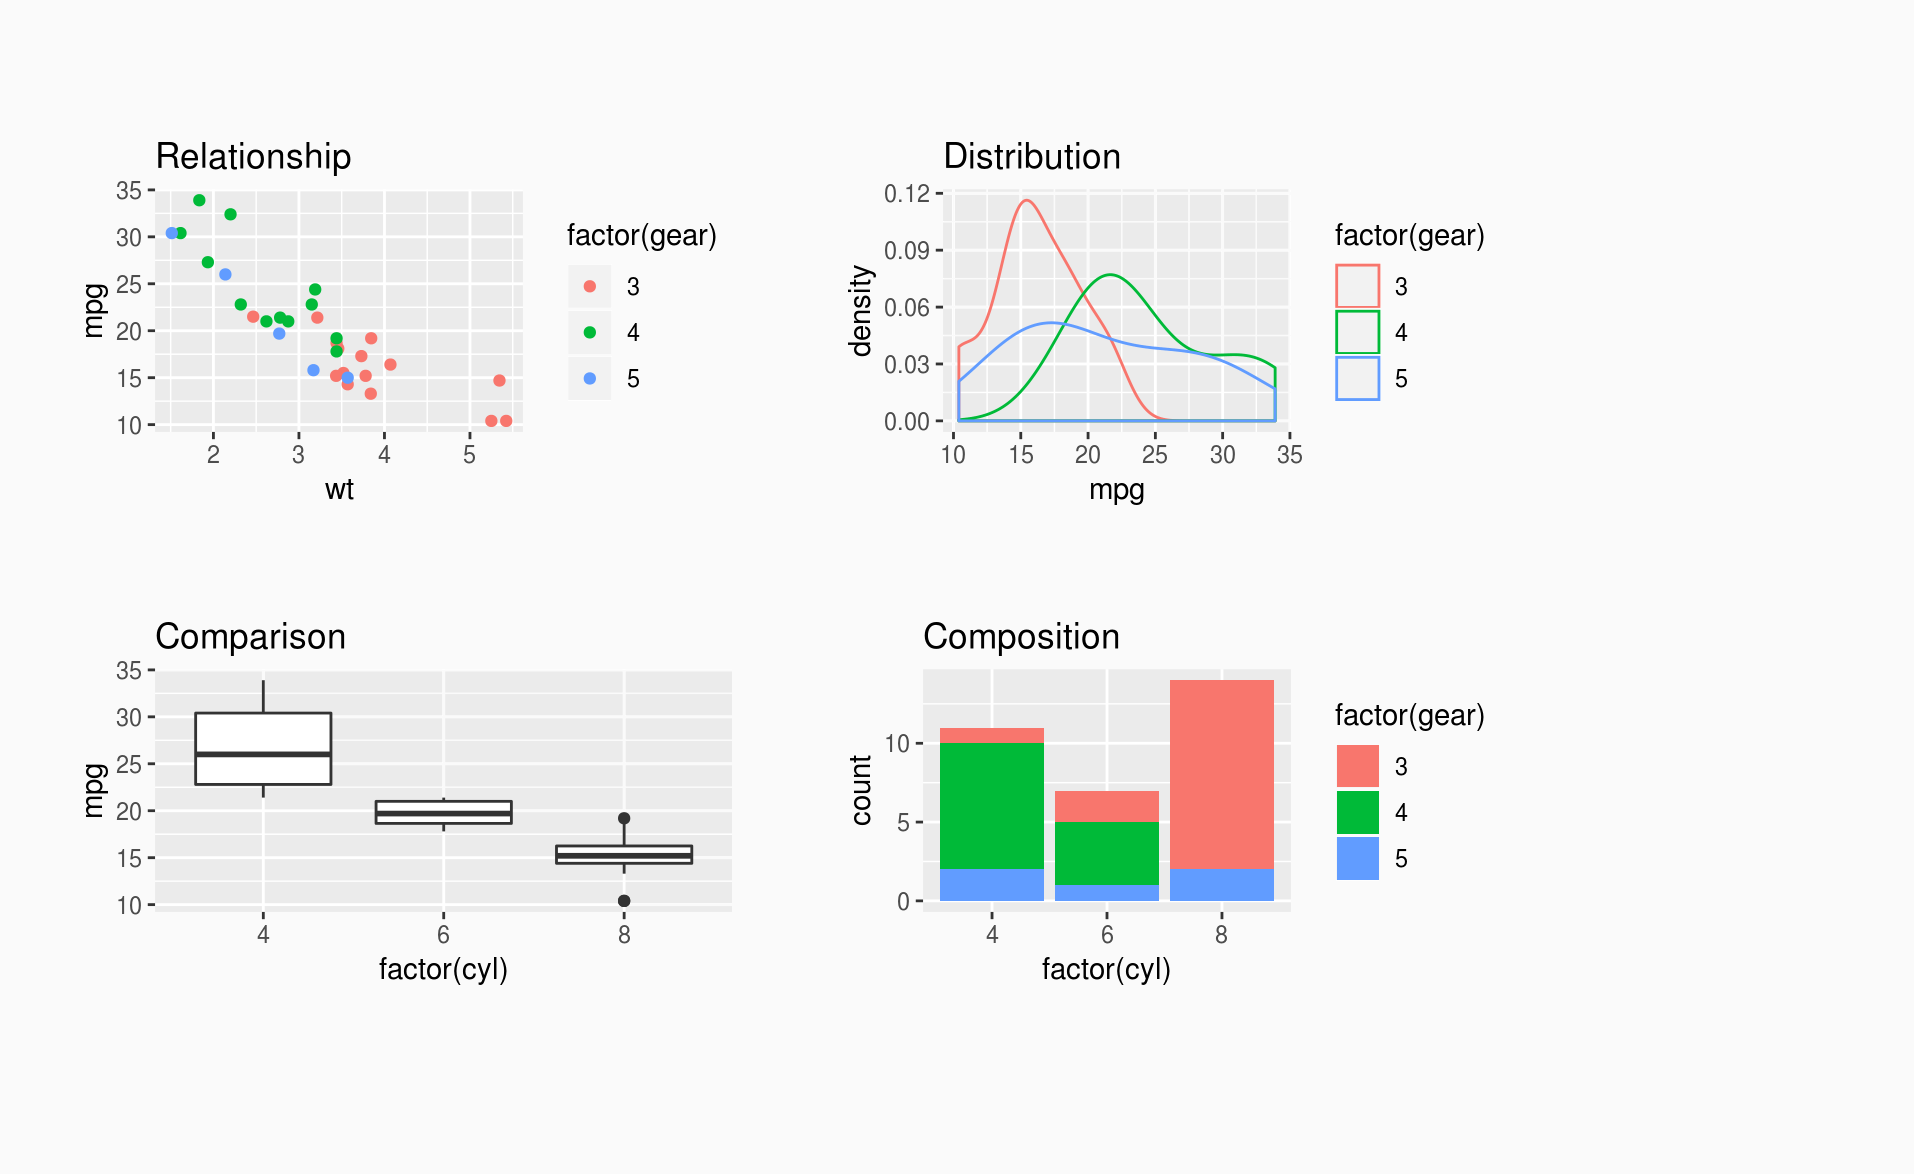
Generating Graphics with GGPlot
GGPlot is an open-source data visualization package for the statistical programming language R. GGPlot is intuitive, allowing for extensive flexibility and customization of plots. Use it as an alternative to Tableau for all your data analysis needs!
Preparing your DataJam Presentation
These guides will set you up for success and contain everything you need when it comes time to design, prepare and present your scientific posters and presentations at the DataJam!
